IONIX SOFTWARE, INC.
This paragraph contains a brief description of the CALC block flow chart and timing diagram.
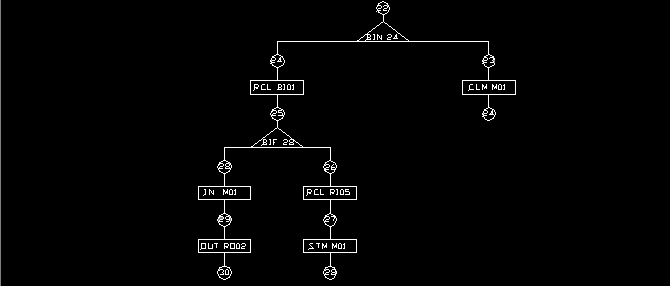
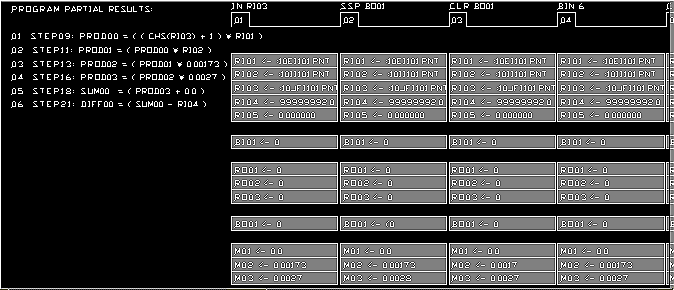
The CALC block flow chart and timing diagram is a drawing with the flow chart of the logic the CALC block source code is implementing, and a snap-shot of the inputs, outputs, memory and stack contents during the entire CALC block processor execution STEPS. The flow chart is a quick "image" of the logic built behind the CALC's source code. The timing diagram shows in each STEP, what happens with inputs, outputs. memory and CALC's implemented stack.

Figure 4.1
In Figure 4.1 the "image" of the source code is displayed. One can easily see, at a glance, what is the CALC block doing and determine if malfunctions are present.

Figure 4.2
In Figure 4.2 a magnified section of the flow chart is displayed. One can see the STEPS, decisions, and the instructions which follow.

Figure 4.3
In Figure 4.3 a detailed section of a timing diagram is displayed. One can see in this diagram, the STEP, instruction, inputs, outputs, memory, and stack contents during processor cycles.
Key Benefits


