IONIX SOFTWARE, INC.
This paragraph contains a brief description of the Block Link Diagram Drawings.
The Block Link Diagram is a color drawing in which all control block symbols were computer-generated. Blocks are arranged in a matrix with rows and columns of blocks. The first column consists of input blocks, the last column consists of output blocks, and the middle consists of general blocks. The drawing is self-generated and self-maintained, at request, from the online CP's database.

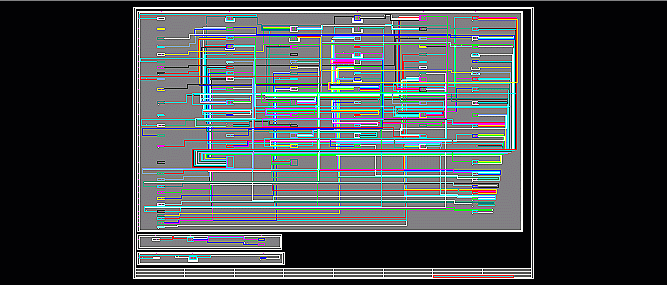
Figure 2.1
In Figure 2.1 a CP's Block Link Diagram is displayed. One can observe that this CP has different, separate, control loops.

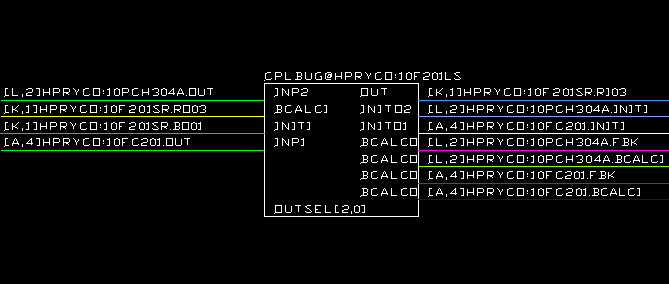
Figure 2.2
In Figure 2.2 a detail with control blocks from a BLD is displayed. One can see the input and output path connections for the sink and source corresponding blocks. All internal/external block connections are captured and displayed.

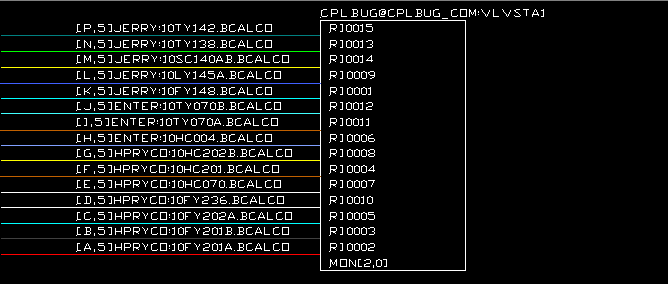
Figure 2.3
In Figure 2.3 the connections for a MONITOR block are displayed. One can see that the block has embedded the CP's letterbug in its name identifier.

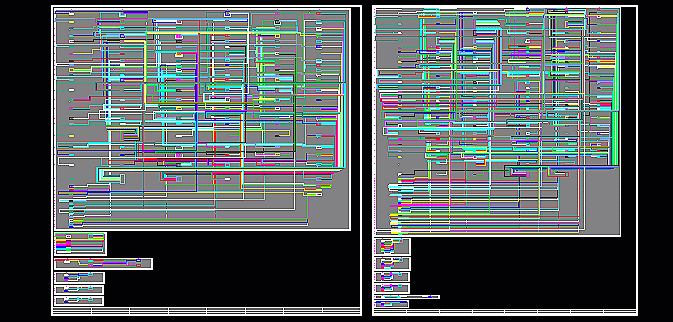
Figure 2.4
In Figure 2.4 two BLDs are displayed. One can see in each CP's BLD different control loops. This might help when plant shutdowns.
Key Benefits
![]() One general view of the control strategies implemented in a CP.
One general view of the control strategies implemented in a CP.![]() Easy identify control loops and their components.
Easy identify control loops and their components.![]() An image of the CP loading and I/O distribution.
An image of the CP loading and I/O distribution.
![]() Correlation with the corresponding P&ID.
Correlation with the corresponding P&ID.
![]() Combine with industry software packages (PI, Info X, ...) and get real-time values for
inputs/outputs.
Combine with industry software packages (PI, Info X, ...) and get real-time values for
inputs/outputs.


